
SYSTEM_SERVICE_EXCEPTION (0x3B) at random — sometimes a
week apart, sometimes every day or two. The crash dumps pointed at
Windows' graphics components, but the
actual cause was Avast's File Shield driver leaking kernel
memory — over a million un-freed allocations — until Windows ran out
and fell over. Removing Avast fixed it permanently. Below is the full
diagnostic trail, with the evidence, so you can run the same playbook.
If you're dealing with a crashing PC, and you're getting bug check code
0x3B SYSTEM_SERVICE_EXCEPTION, parameter 1
0xC0000005, this article is for you. I personally had this
problem — it wasn't a client or a job, it was my PC — and I wasted A LOT
of time trying to fix it. I run a residential tech support business here
in Manhattan, so fixing crashing PCs is literally what I do for a living
— which is exactly why this one was so frustrating. I was having
persistent BSOD crashes (except
without the blue screen, just sporadic rebooting) with seemingly no
rhyme or reason behind them. Sometimes I'd go 7 or 8 days without a
crash, other times I'd get BSOD crashes every couple of days.
Alright, so if you've landed here I imagine you've already run through
all the usual prescribed "fixes" — graphics driver reinstall, maybe
reseated your RAM, gave it the old sfc /scannow — and
nothing's worked for you.
You've probably read more than the odd how-to article, dug around on some forums, maybe you've even gotten so desperate that you watched a YouTube video about it. I know I did, and I absolutely hate watching YouTube videos for technical help. But I was at a loss, seriously.
I don't mean to sound arrogant, but I sort of pride myself on having
never run into a PC/tech-related problem that I wasn't able to solve on
my own (and by on my own I mean with every possible resource available +
my junior engineers Claude & ChatGPT). Well, this
0x3B SYSTEM_SERVICE_EXCEPTION crash was seriously calling
that claim into question.
Okay, so let me get to it.
The situation
- Windows 11, 64 GB RAM, 2 TB NVMe SSD, NVIDIA RTX 4070 GPU
- BSOD roughly every 1.5 days, no obvious trigger
-
Bugcheck:
0x3B SYSTEM_SERVICE_EXCEPTION, parameter 10xC0000005(access violation) -
Crash dumps showed the failure inside
dwm.exe(the Desktop Window Manager) andwin32kbase.sys
Googling those module names, you'll see a lot of guidance such as:
The
0x3B SYSTEM_SERVICE_EXCEPTIONpaired with0xC0000005(Access Violation) anddwm.exeindicates a critical crash in the Desktop Window Manager, almost always caused by corrupted graphics drivers, faulty RAM, or conflicting overlay software.
I just googled this — this is 100% the first thing that came up. Strong language, right? One could argue too strong.
Here's a screenshot of Reliability Monitor, for all you visual learners out there.
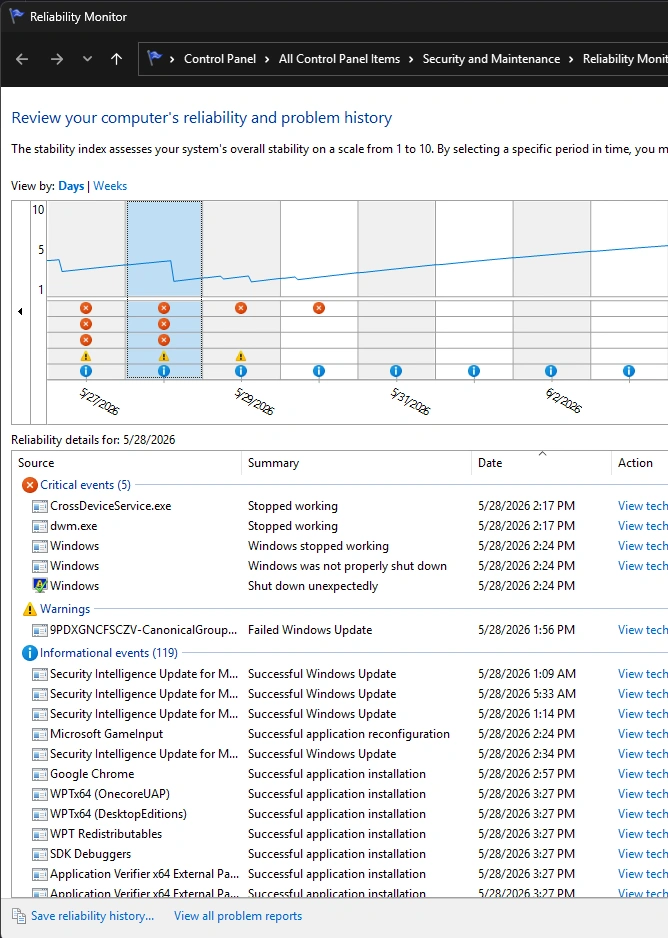
Ok, so first things first: I'm working with the assumption that you're experiencing the same crash I was. If you're not, or you're not sure, go figure out exactly what you're dealing with first. Here's a little how-to on doing exactly that: how to diagnose a Windows crash.
Alright, moving along — going forward, I'm breaking this down into two sections:
- Diagnostic steps — gathering information, no changes to the system.
- Corrective action — actually making changes to the system.
So first, we diagnose. Later, we correct.
Diagnostic Steps
Step 1 — Reading the dump file
Like any good tech, I first read the dump file to figure out what's going on. And by "read the dump file," I mean dump it into an LLM. (Jokes aside — knowing how to read a dump file is a genuinely useful skill, and if you are going to lean on an LLM for it, prompt it for the raw diagnostic output: no assumptions, no "most likely caused by" nonsense.)
- Download WinDbg (free, from Microsoft).
-
Run
!analyze -von the minidump files inC:\Windows\Minidump.
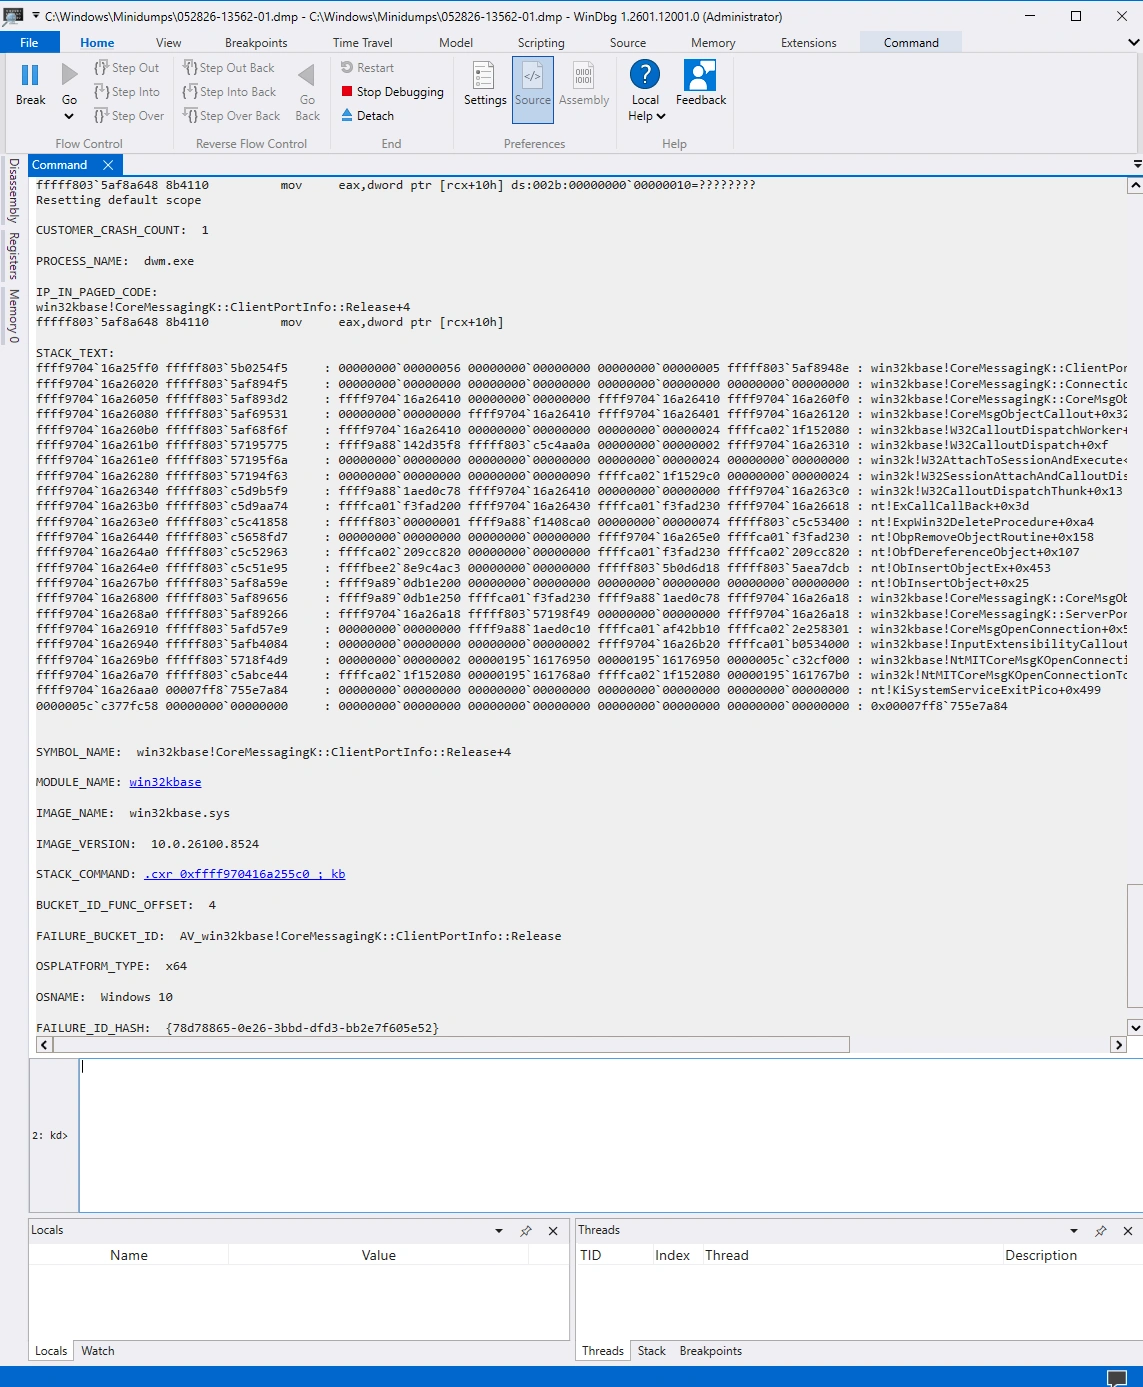
!analyze -v: the failing call stack surfaces in
win32kbase / dwm.exe, right after a failed kernel allocation.
Reading that stack trace, we can see we're dealing with a failed kernel
allocation (ObInsertObject returning a failure) followed by
a null-pointer crash on the cleanup path.
How to actually read that stack trace.
!analyze -v prints a call stack — a numbered list of
the function calls that were in progress when Windows died, stacked newest
on top. The bottom of the list is where it all started
(the origin); the top is the call that actually crashed.
Each line reads module!function+0x… trailed by a wall of hex
addresses — ignore the hex, you only care about the
module!function names. Reading bottom-up: near the bottom,
ObInsertObject (a kernel routine that's supposed to hand back
a brand-new object) returns a failure code instead — that's the
failed allocation. The frames above it are cleanup code reacting to that
failure; one of them goes to use the object it expected to get back, but
because the allocation failed, that slot is empty — a null
(zero) pointer. Reading from a zero address is illegal, and that illegal
read, right at the top of the stack, is the crash: the
0xC0000005 access violation (which Windows reports as
SYSTEM_SERVICE_EXCEPTION, 0x3B — "a kernel-mode
call blew up").
In plain English: the kernel asked for memory, got told "no," and Microsoft's own cleanup code wasn't written to handle "no."
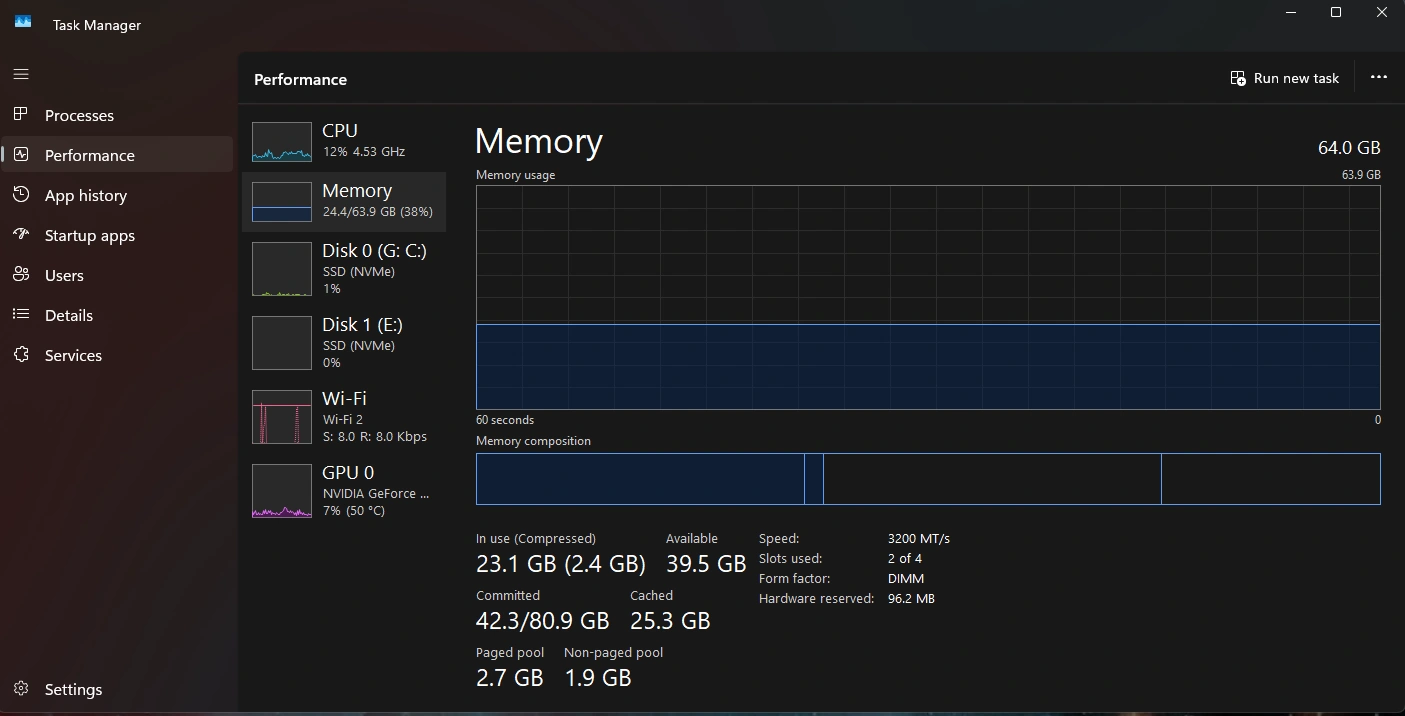
So that's what we need to look into: a failed allocation. The kernel asked for a small piece of memory and was refused. With 64 GB of RAM and Task Manager showing gigabytes free, that should be impossible — how is a machine with that much memory "out"? The catch is that the kernel doesn't spend from the same pile your apps do. It has its own, much smaller reserve, and that's what had run dry. To see how, you need to know about pool memory.
Step 2 — Understanding the kernel & pool memory
Windows reserves a separate region of memory for the kernel and drivers, called pool memory (it comes in "paged" and "nonpaged" flavors). Think of it as the kernel's wallet. Your 64 GB of RAM is the bank account; the wallet is what drivers actually spend from, and it's much smaller.
Every driver on your system — graphics, network, antivirus, whatever it is — takes money out of this wallet for every operation, and is supposed to put it back when it's done. A driver that takes and never returns is a pool leak. It's a bit like having a fraudster running the accounting department: the wallet slowly empties, but the bank account still looks full. That's why Task Manager showed nothing wrong.
When the wallet finally hits empty, everything that needs a kernel allocation starts failing at once — totally unrelated subsystems all reporting "insufficient resources" within minutes of each other. Your system crashes like Enron.
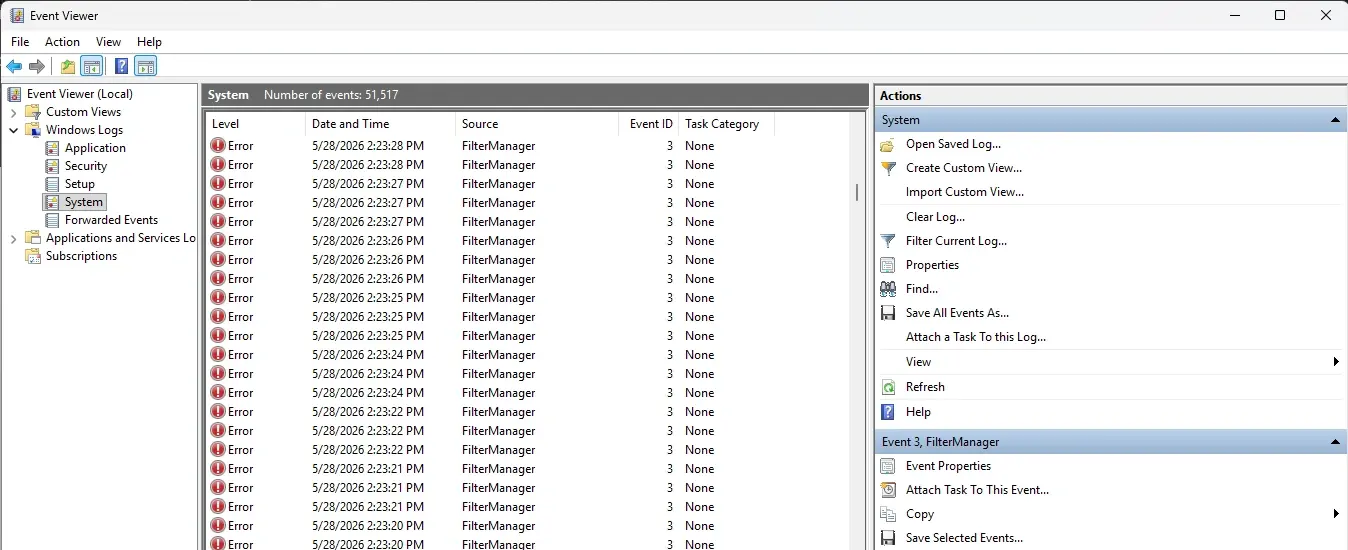
So if your Event Viewer shows a burst of failures across services that have nothing to do with each other right before a crash, suspect pool exhaustion.
Step 3 — Prove the leak exists
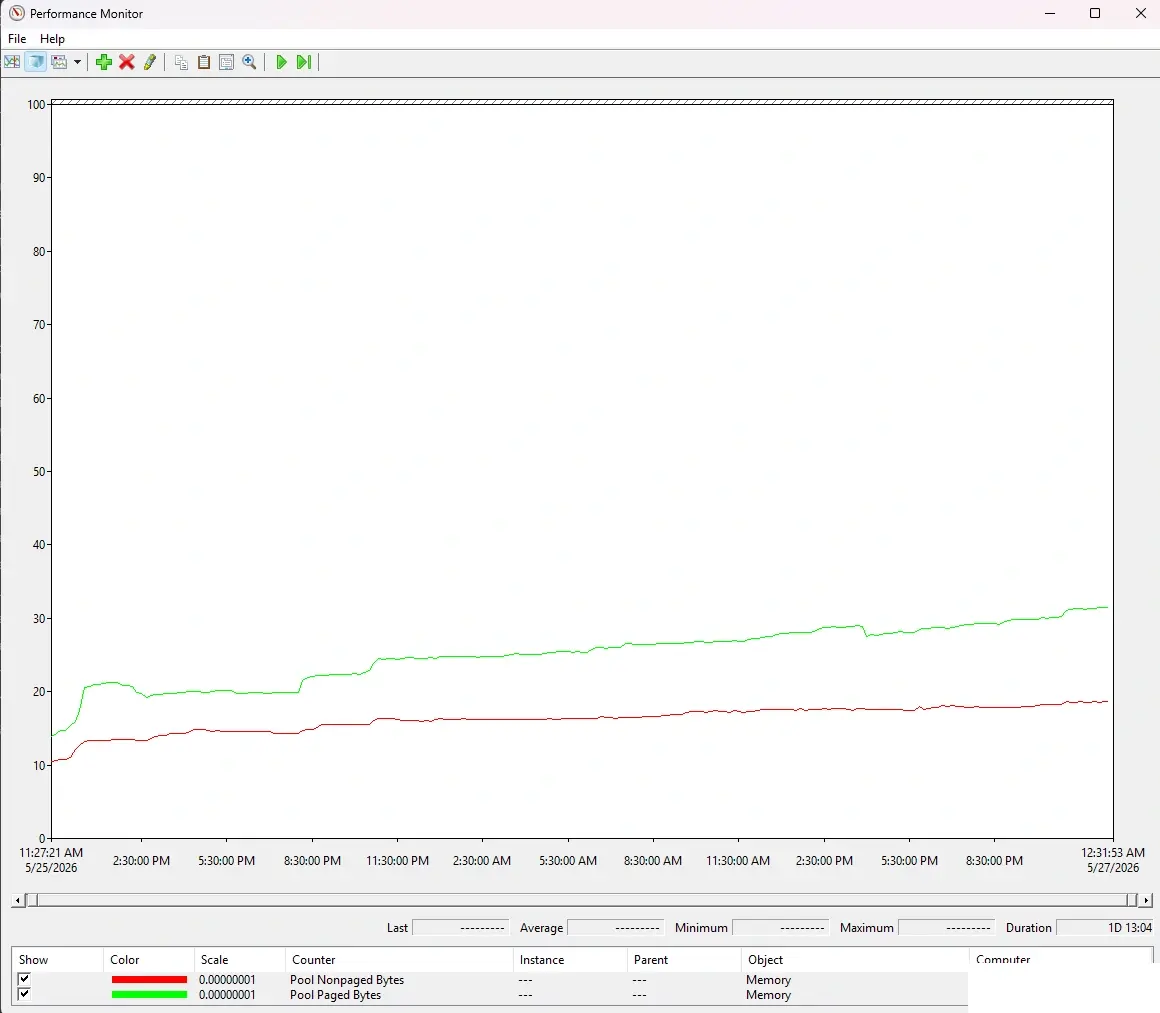
I set Performance Monitor to log pool sizes over time. Over a 37-hour window, paged pool grew +1.76 GB (+127%) and nonpaged pool +818 MB (+77%) — monotonically. It only ever went up. Normal pool usage breathes in and out with workload. A line that only climbs is a leak.
Step 4 — Find who's leaking
Two tools, both free:
fltmc filters (admin command prompt) lists every
file-system filter driver loaded. Mine showed a security stack I'd
never consciously built: 14 Avast kernel drivers, 3
Malwarebytes drivers, and Windows Defender — all loaded
simultaneously. More on why that matters later.
PoolMon (from the Windows Driver Kit) shows pool usage broken down by four-letter "tags" each driver stamps on its allocations. Sorted by size, one tag dominated:
FMfn— ~524 MB, with 1,020,974 outstanding allocations
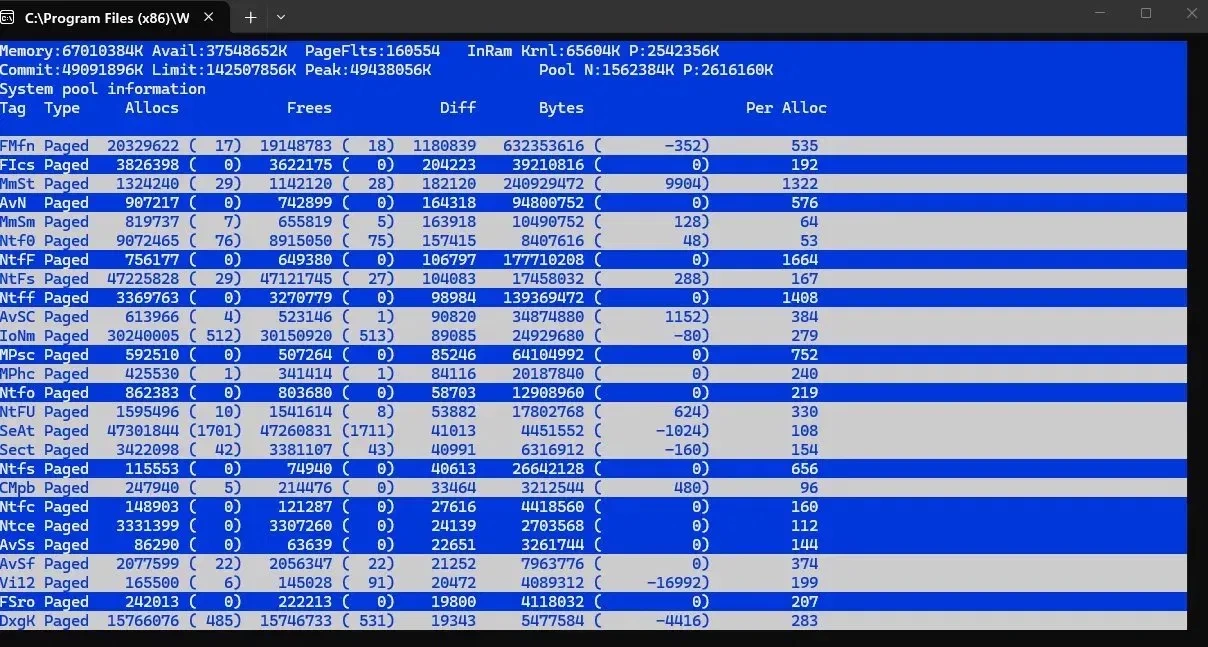
So what is FMfn? It's a small chunk of memory Windows' Filter
Manager hands out to answer one question: "what's the name of this file?"
Every time a filter driver — like an antivirus on-access scanner — wants a
file's name, it borrows one of these, and it's supposed to give it right
back the instant it's done. Over a million of them still outstanding means
some filter driver was asking "what file is this?" on every single file
operation and never letting go of the answer.
Here's the annoying catch: that FMfn memory gets tagged under
Microsoft's Filter Manager — not under whichever scanner actually asked for
it. The Filter Manager is the middleman every file-scanning driver routes
through, so PoolMon ends up pointing at Windows itself, even though some
third-party scanner is the real hog. Avast, Malwarebytes, even Defender —
any of them could be the one hoarding. The tag tells me it's "some
on-access file scanner," but not which one. The only way to find
that out is to start switching them off one at a time.
Step 5 — The A/B test that turned suspicion into proof
This is the part most troubleshooting skips, and it's the part that matters. Correlation gets you a suspect. A controlled on/off test gets you a conviction.
Malwarebytes was the Free edition — on-demand only, no real-time
scanning — which eliminated it as the constant file-watcher. That really
left only Avast's File Shield as the possible cause. So with PoolMon open
and FMfn on screen, I turned Avast's File Shield off — then
back on, then off again — and watched the tag respond:
| File Shield state | Per-refresh behavior | Running total (Diff) |
|---|---|---|
| ON | ~+895 net new allocations per tick | climbing relentlessly |
| OFF | net negative (more freed than allocated) | flat, then draining |
| Back ON | +895 net per tick again | climbing again |
| OFF for ~10 hours | balanced/negative | drained from 1.18M down to 573k |
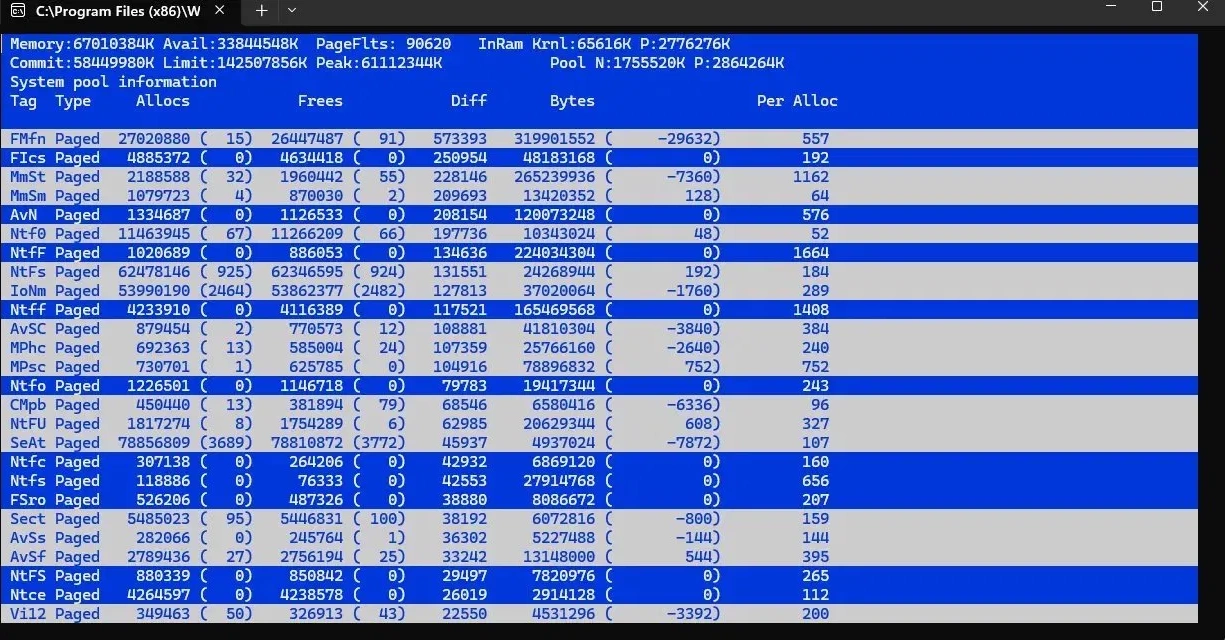
The leak started and stopped in lockstep with one driver's switch, repeatably, in both directions. That's causation.
FMfn up briefly
despite the Avast shield still being off. For a second, I thought I was going
to have to start diagnosing all over again. But when I wrapped up my work and
killed a few massive processes, those allocations were freed and the total
fell back down. This is the difference between a leak and a
load. A leak never gives the memory back. So, long story short — if
you're running this test yourself, watch it over hours, not minutes.
Corrective Action
Step 6 — The fix
Standard uninstall doesn't fully remove an antivirus — kernel drivers
love to linger. Avast ships a dedicated removal tool,
avastclear.exe, which handles its own Safe Mode reboot.
Two practical notes from doing it:
- Download the tool before you reboot into Safe Mode. Safe Mode has no networking by default. Ask me how I know.
-
Verify the removal. After reboot, run
fltmc filtersagain and confirm zeroasw*entries remain. If a driver's still listed, it's still loading.
Step 7 — Verify it worked
The proof is in the numbers. With Avast gone, pool usage went flat and the crashes stopped for good — here are the same Task Manager and Resource Monitor views from before, now back to normal:
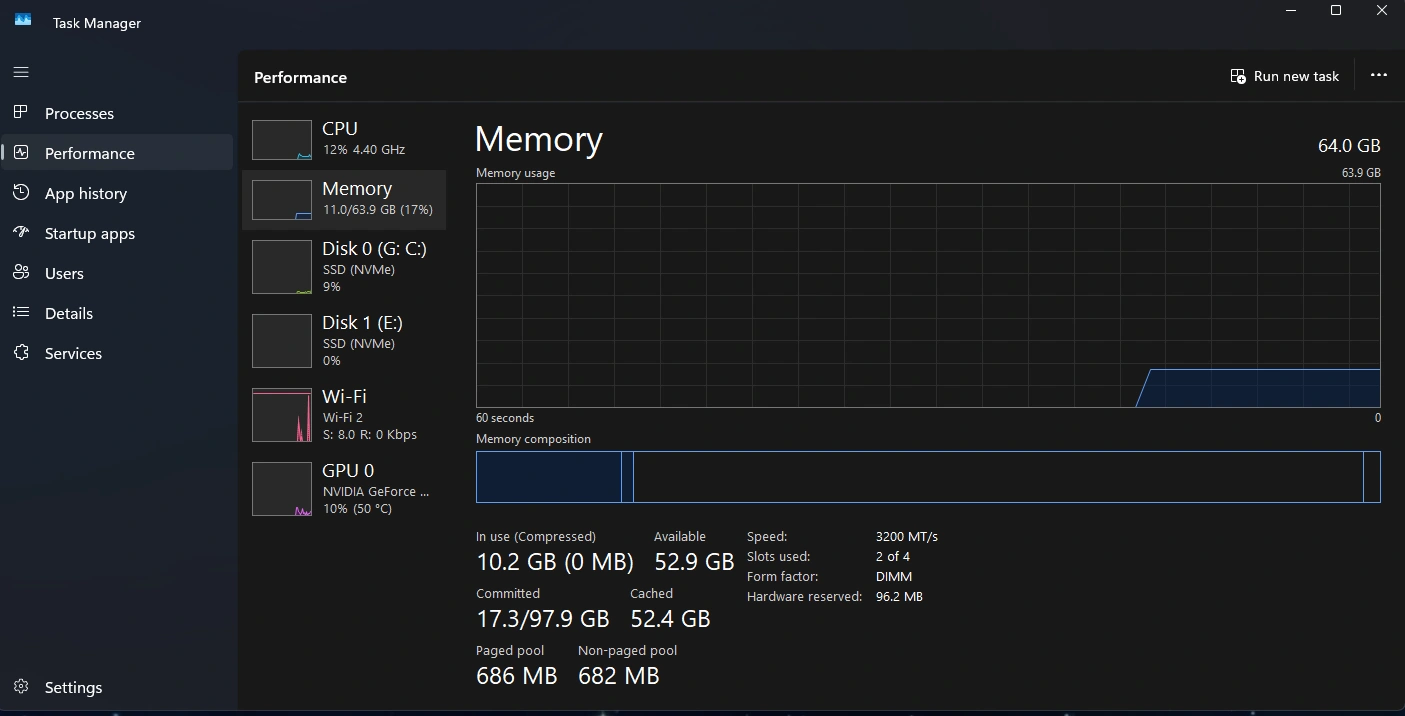
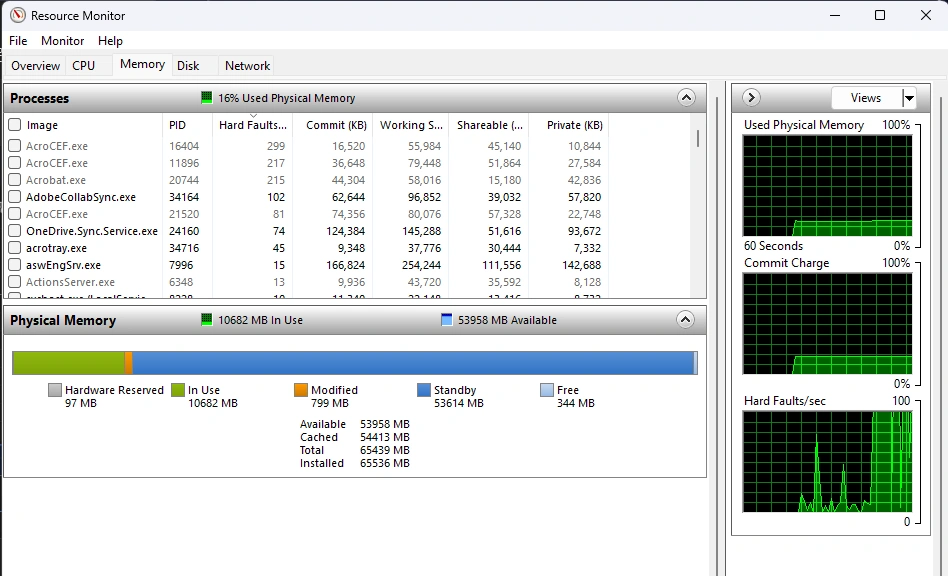
So there we have it, found and fixed! It took way longer than I'd have liked, and it was far from a straightforward path, but I am happy to say that I'm still undefeated!
The lessons learned
Your "extra protection" can be the risk
The contributing factor here wasn't just one buggy driver — it was the stack. Three security products running concurrently means three sets of kernel drivers intercepting every file operation, all spending from the same kernel wallet, all contending for the same I/O path. Even without a leak, that's compounding pressure on a finite resource.
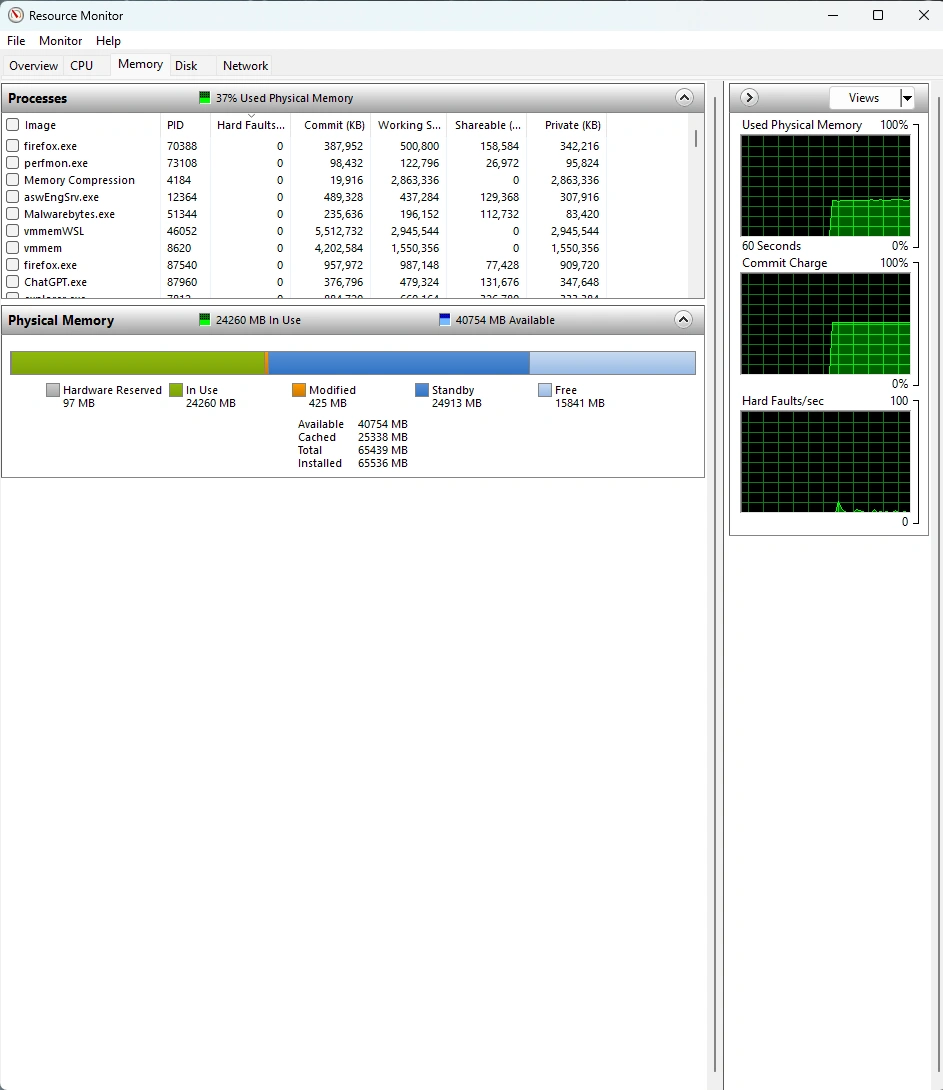
For most home users in 2026, Windows Defender alone is genuinely sufficient. It's built in, it doesn't nag you to upgrade, and it's one set of kernel drivers instead of three. If you installed a third-party antivirus years ago out of habit, it may be costing you more stability than it's buying you security.
Where it crashes isn't what caused it
Where a crash happens is not the same as what caused it. This principle is at play in most hard-to-solve crashes.
It's like when the apartment above yours bursts a pipe. Pretty soon, you'll see water leaking through your ceiling. You could plaster the ceiling, but that's not going to fix anything until that leaky pipe is fixed.
In my dumps, the Desktop Window Manager asked Windows for a small piece of kernel memory, Windows said no, and a cleanup bug in Microsoft's own code turned that "no" into a crash. DWM was like that water leaking through the ceiling. The cause, though, originated elsewhere — with Avast, which was like our ruptured pipe.
Run this playbook yourself
-
Pull bugcheck codes from your minidumps with WinDbg
(
!analyze -v) - Check Event Viewer for clustered "insufficient resources" failures before crashes
- Log pool memory in Performance Monitor for 24–48 hours — does it only ever climb?
fltmc filters— how many security products are actually loaded?- PoolMon — which tag is hoarding?
- Isolate: toggle one suspect at a time and watch the tag respond, over hours
-
Remove the offender with its vendor removal tool, not just
Add/Remove Programs, and verify with
fltmc
- The
SYSTEM_SERVICE_EXCEPTIONdumps blamed Windows' graphics — but the named module isn't always the culprit. - Avast's File Shield driver was leaking kernel memory until Windows ran out; PoolMon proved it with over a million un-freed allocations.
- Removing Avast fixed it permanently — and the evidence trail is repeatable on any machine.
- Chasing your own mystery crash? Start with the guided PC crash & slowdown diagnostic, or read another field case: the WSL2 crash where the error message lied.